Wednesday Reality | The Margin That Kept the Lights On
The fault that cleared
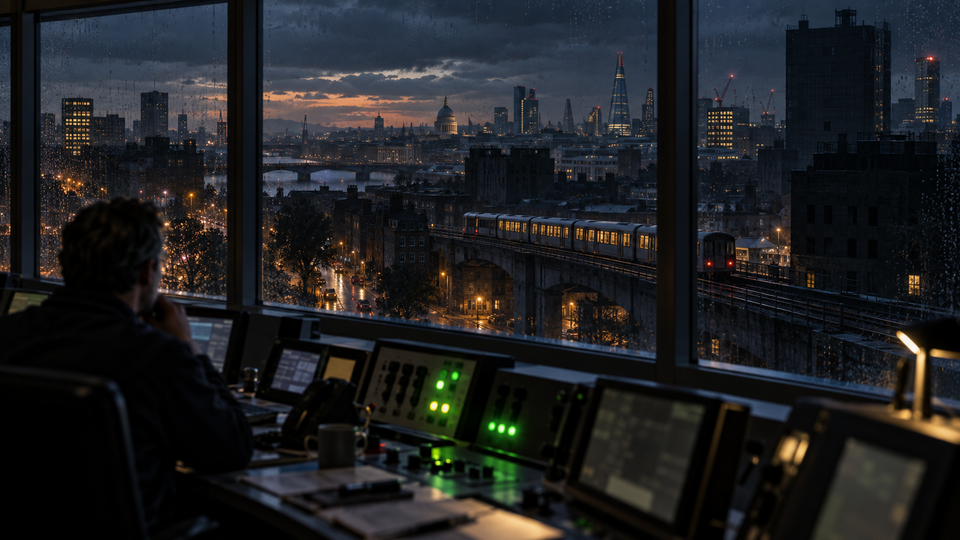
At 16:52 on 9 August 2019, lightning struck a 400 kV transmission line north of London. Its protection equipment cleared the fault in less than a tenth of a second, and the circuit returned to normal operation roughly twenty seconds later. Judged at the boundary of that circuit, the protective system had done precisely what its designers intended. Yet more than a million people would lose power, while parts of the railway would remain disrupted after the electrical system recovered. The fault that everyone could see was not the event that the whole system had to survive. [1]
An electricity grid has to match generation and consumption continuously. When supply falls, its frequency falls; the kinetic energy in spinning machines slows that change, automatic frequency response acts to arrest it, and reserve subsequently restores the balance. These mechanisms serve different time horizons. Energy that buys a few seconds does not provide an indefinite reserve, and a resource that can arrive in fifteen minutes cannot undo a failure that unfolds in seconds. Stability depends on the amount of response available, where it sits, how quickly it can act and what happens after the first response has been spent. [2][3]
The lightning strike coincided with losses elsewhere. Hornsea One offshore wind farm reduced its output by 737 MW; the steam turbine at Little Barford lost another 244 MW; smaller generators connected to local networks also disconnected. Falling frequency triggered protection on yet more local generation. The system operator had arranged automatic response against the loss of its largest single source of supply, 1,000 MW, as the applicable standard required. The combined loss passed 1,480 MW. Available response, including batteries, arrested the initial fall and began to lift the frequency. Then another turbine at Little Barford tripped. The response had already been deployed. Frequency fell far enough for an automatic scheme to disconnect approximately five per cent of demand, protecting the wider grid by cutting power to customers. [1]
This matters because the common moral of such incidents would be wrong. The operators had not forgotten to keep reserve. They had planned for a defined disturbance, and several interacting events exceeded its boundary. Planning for a larger disturbance would carry a cost; planning for every conceivable combination would be impossible. The interesting engineering question concerns the envelope the system can absorb, and how its behaviour changes as successive failures consume that envelope. [1][4]
When the first incident spends the reserve
In IT, we usually discuss capacity as though it were a stock: a number of engineers, machines, story points or available hours. Response capacity has a temporal dimension that these totals conceal. An on-call engineer handling a production incident cannot simultaneously investigate another failure, review a hazardous deployment and complete a planned migration. A platform team that has diverted its specialists to restore a critical service has spent part of its ability to respond to whatever happens next. The headcount remains unchanged. The condition of the system does not.
The grid incident exposes the difference between surviving a disturbance and surviving the next disturbance while recovering from the first. An IT service faces the same question when a failed release draws down the error budget, an emergency patch occupies the deployment pipeline, and the engineers who understand a dependency spend the day repairing state. If another failure arrives during that interval, it encounters a system with less room to manoeuvre. The second incident need not be more severe than the first. Its consequences depend on the reserve already consumed and the recovery still unfinished.
This is why an incident review that ends when customer traffic returns can miss the important part. The database may still need reconciliation. A temporary bypass may require removal. The queue of postponed changes may now contain several risky releases. The people who handled the incident may have cancelled work that other teams still expect on its original date. Service restoration marks one recovery point; it does not replenish every reserve used to reach it.
The queue behind the green dashboard
Most engineering plans assume a clean separation between planned delivery and unplanned work. Production systems refuse that separation. Operational interrupts, integration surprises, security fixes, data repairs and support escalations arrive through different doors but compete for the same attention. If a team schedules all its available time against roadmap commitments, every interruption creates a queue somewhere else. The queue may appear as delayed reviews, deferred tests, unresolved defects or design questions pushed into implementation. It need not appear on the roadmap at all.
The first interruption delays a feature. Its unfinished work enters the next planning period beside the commitments already made there. A second interruption arrives against the larger load. Soon delivery slows even if the team works just as hard, because more partially finished work creates more dependencies, more context switching and more decisions waiting for the same specialists. The planning system records a succession of missed estimates. The operating system has accumulated demand faster than it can clear it.
The grid announces an imbalance through frequency. Software organisations have no equivalent instrument. A dashboard may report green service availability while engineers postpone maintenance that keeps the service recoverable. A sprint may close its tickets while downstream teams absorb integration work that those tickets did not include. A release train may leave on time because somebody removed testing, documentation or migration support from its definition of departure. Those choices can preserve a metric while changing the system the metric was supposed to describe.
Nor can the problem be solved simply by declaring a fixed percentage of unallocated time. A percentage says nothing about the expected shape of an interruption. Ten spare hours scattered across five people may be useless if a failing service requires one specialist for an uninterrupted day. Reserve has to be available at the point of failure, within the relevant time window, with the authority and knowledge to act. Capacity that arrives after an architectural decision hardens cannot prevent the rework caused by that decision.
Response has a topology
An incident crosses more than one technical boundary. A degraded identity service may affect checkout, customer support tools and an internal administration console. Restoring the identity service does not necessarily restore sessions, replay rejected transactions or reconcile actions taken during the outage. Each dependent system has its own thresholds, protective behaviour and recovery procedure. The original failure can end before the consequences it triggered.
The railway after the 2019 outage illustrates this precisely. Some trains shut down when frequency crossed their protective thresholds, and a number required a technician to restart them. The grid returned to a stable 50 hertz within minutes. Rail services followed a different recovery curve. The protection made sense at one boundary, yet it created work beyond that boundary which restoration of electrical supply alone could not remove. [1]
Software systems often encode the same assumption in retries, circuit breakers, rate limits and queues. These mechanisms can prevent a local disturbance from becoming a catastrophic failure, but they also determine where the cost goes. A circuit breaker may preserve a service while dropping a customer journey. A queue may preserve requests while building a backlog that takes hours to drain. A retry can turn a brief downstream fault into a surge after recovery. Whether the mechanism helped depends partly on how the wider system behaves once the original dependency returns.
Organisational boundaries amplify this effect. The platform team closes its incident when the API responds. Product engineering still has failed jobs to replay. Support still has customers to contact. Finance may still need to reconcile transactions. If every group measures only its own return to normal, the company can record several successful recoveries while customers experience one prolonged failure. The topology of the work matters as much as the duration of the initiating fault.
Load shedding by another name
The grid deliberately disconnected some demand to prevent a wider collapse. IT groups also shed load, though they seldom name the action so plainly. They postpone a migration, stop accepting changes, disable a feature, defer a release or decline an integration. These can be sound responses. Their quality depends on whether anyone has thought through which demand can safely wait, which can be dropped, and which cannot be allowed to accumulate unnoticed.
Without such distinctions, a team facing an incident makes its choice by proximity. The work with the quietest stakeholder slips; the work with the loudest deadline proceeds; the most technically dangerous backlog item remains invisible because nobody owns its immediate consequences. Eventually the organisation treats every delayed commitment as equally urgent. More status meetings then compete with the response capacity they were intended to coordinate. A system that cannot choose what to stop has no reliable way to protect what must continue.
Adding more people can help when the reserve genuinely consists of hands that can act independently. It helps less when the constraint lies in access, expertise or decision rights. Five engineers waiting for one person to approve an interface change do not provide five units of response. More parallel work may increase the number of decisions that person must make. A capacity report that counts people without tracing dependencies can therefore show improvement while the system’s ability to recover deteriorates.
The 2019 power outage ended with an uncomfortable distinction. The line’s protection worked, the operator’s response covered the contingency it was designed to cover, and the wider sequence still reached customers and trains. In IT, each team can likewise demonstrate that it followed its procedure. The deployment pipeline can show green, the incident can close, and the roadmap can retain its dates. Somewhere beyond those boundaries, a queue is still filling with the work the system used to keep its lights on.
Sources
[1] National Grid Electricity System Operator, Technical Report on the Events of 9 August 2019. https://www.ofgem.gov.uk/sites/default/files/docs/2019/09/eso_technical_report_-_final.pdf
[2] National Energy System Operator, What is inertia? https://www.neso.energy/energy-101/electricity-explained/how-do-we-balance-grid/what-inertia
[3] National Energy System Operator, Slow Reserve. https://www.neso.energy/industry-information/balancing-services/reserve-services/slow-reserve
[4] Ofgem, Investigation into 9 August 2019 power outage. https://www.ofgem.gov.uk/publications/investigation-9-august-2019-power-outage




Member discussion