Measuring What Matters: Introducing Transduction Quality Score (TQS) for Adaptive Organisations

Modern companies are flooded with ideas, experiments, and PoCs. However, how many of these actually become scalable, reusable, production-grade capabilities? How many turn into real value across the organisation?
The answer remains often unclear. That is where Transduction Quality Score (TQS) enters.
TQS provides a systems-level metric for organisations adopting a fluid, layered structure. It helps teams evaluate how well innovation moves from the edge (Surface Layer) through Enablement (Flywheel) into shared, stable infrastructure (Core).
The Fluid Organisation Model in Brief
Organisations rarely suffer from a lack of ideas. They suffer from the inability to turn promising output into durable capability. In traditional models, this often results in friction between high-speed product delivery and slower platform maturity.
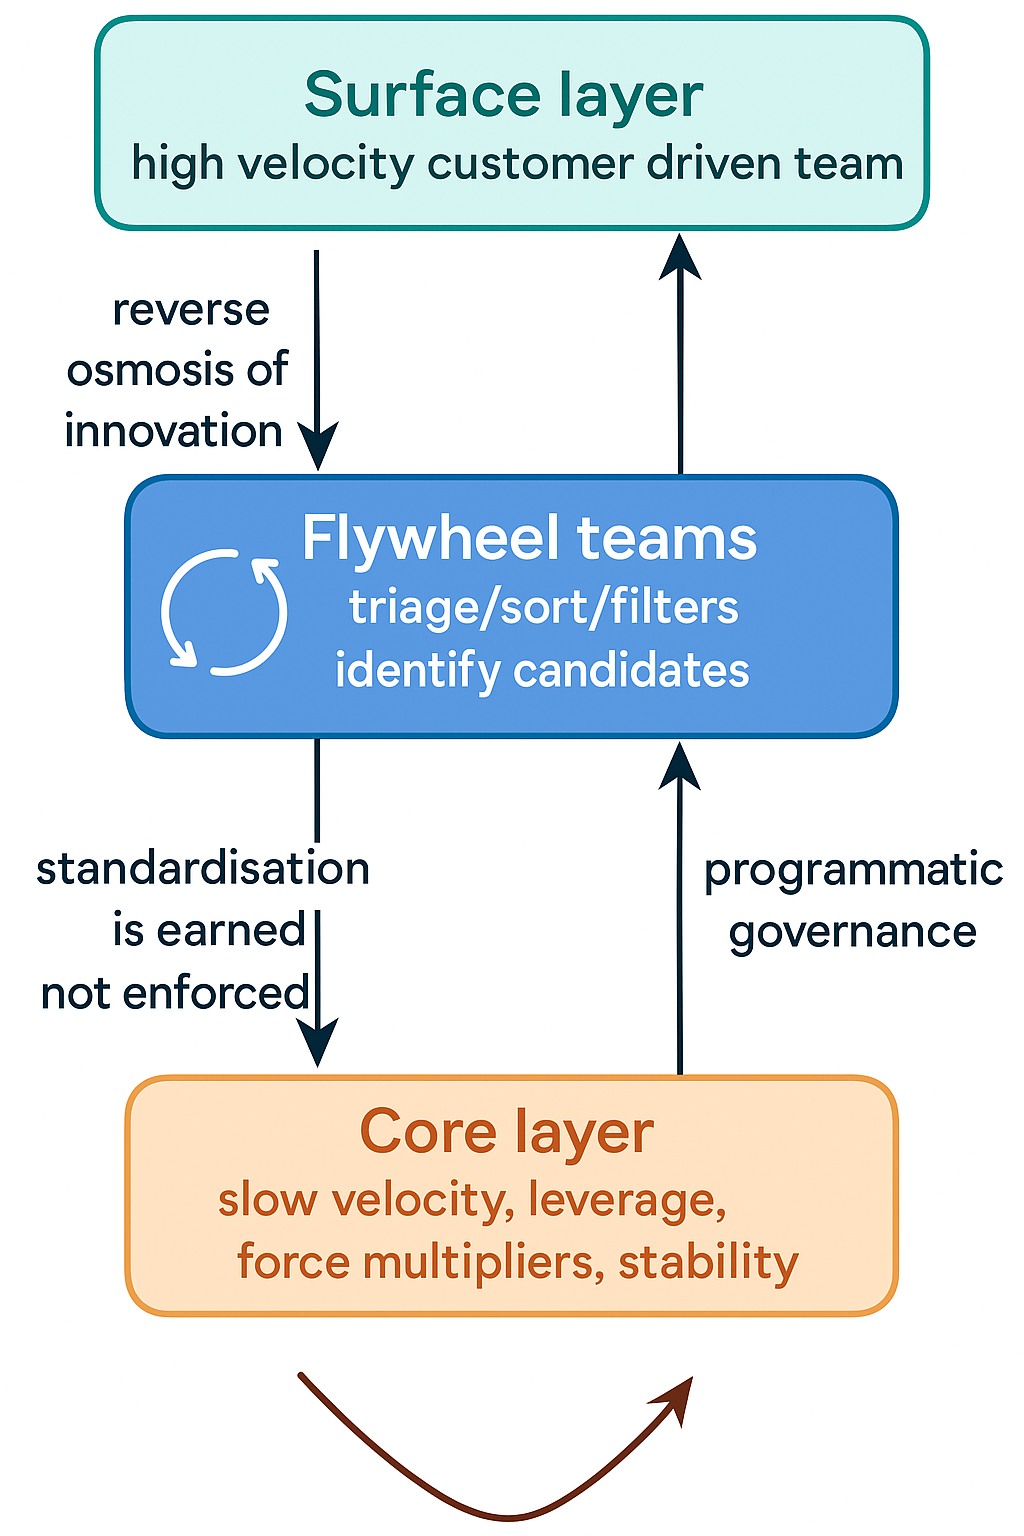
The Fluid Organisation Model introduces a layered structure that acknowledges the gradient of flows between Surface and Core. Rather than forcing all teams to operate at the same speed, it enables alignment through differentiated motion. The aim is not uniform velocity, but coherent transfer of signal and capability.
- Surface Layer: High-velocity teams generating ideas, features, and experiments.
- Flywheel Teams: Enablement units that triage, filter, and convert ideas into reusable platform components.
- Core Layer: Stable teams that embed mature, standardised capabilities into the system.
Ideas move downward via "reverse osmosis". Maturity flows upward through programmatic governance. Standardisation is earned, not imposed.
What is Transduction Quality?
Transduction refers to the conversion of one form of energy or signal into another. In organisational terms, it means transforming raw experimentation output into coherent, composable capabilities.
Because we acknowledge the complexity of building a sound Flywheel system, one that can consist of a variable number of teams and enablement roles, we treat Transduction Quality Score (TQS) as an evolving model. The formula proposed here represents iteration zero: a starting point from which each organisation can refine based on its specific Flywheel structure.
Just as thermodynamic systems use external metrics to read internal conditions, TQS allows companies to assess the health of signal conversion across organisational layers. Over time, teams may discover that their formula for TQS diverges slightly depending on structural complexity, domain specificity, or rate of flow. What matters first is to begin with a shared reference frame and then evolve with intention.
TQS Formula (First Pass):
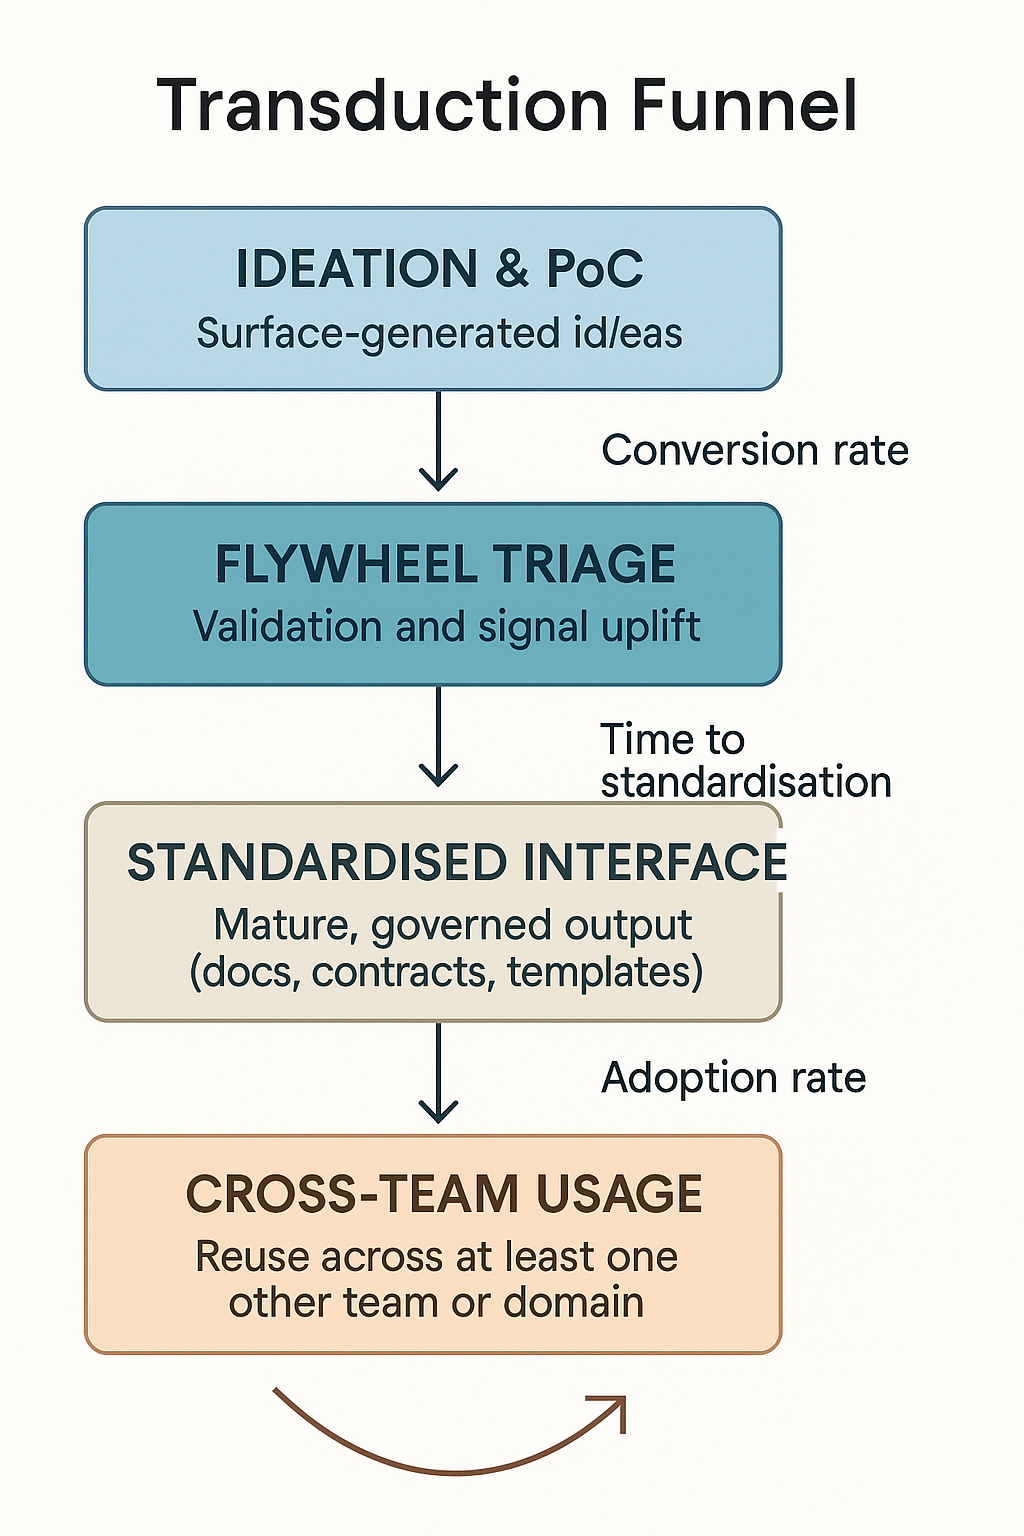
TQS = (Conversion Rate × Adoption Rate × Interface Maturity Score) ÷ Time to Standardisation
- Conversion Rate: Percentage of surfaced ideas or PoCs successfully triaged, refined, and prioritised through the Flywheel layer for further maturation
- Adoption Rate: Percentage of Flywheel outcomes reused by other teams
- Interface Maturity Score: Rated from 1 to 5, based on a structured evaluation:Scoring Guidelines:
1 = No documentation, ad hoc onboarding, no feedback loop
2 = Basic documentation, limited reuse support
3 = Documented interface, initial paved paths or templates available
4 = Self-service onboarding possible, versioning and stability policies defined
5 = Fully governed, observable, versioned, and adopted via paved path - Time to Standardisation: Measured in days or sprints
As a first heuristic, an acceptable TQS might fall above 0.25 on a 0–1 scale, or 25 when scaled to 100. Teams consistently above 0.30 (or 30/100) show strong integration maturity. Scores above 0.50 indicate a high-functioning Flywheel system where ideas reliably become shared value.
Time as a Normalising Factor
Time plays a central role. It introduces realism and enables meaningful comparison across teams. Organisations should define a shared time unit, typically between one and two weeks, and treat this as a baseline denominator.
This shared interval becomes the first threshold value for TQS calibration. While not all organisations transduce outcomes at the same pace, agreeing on a common cycle length ensures fairness in measurement.
"Time does not punish. It protects signal integrity."
Begin with sprints. Iterate intentionally.
Understanding the Formula
To improve TQS, companies must you former picture was three key capabilities:
- Validating what matters (Conversion Rate)
- Designing for reuse (Adoption Rate)
- Delivering maturity (Interface Maturity)
Each layer of the Flywheel either adds friction or promotes flow. TQS helps identify where energy dissipates or compounds.
Why Motion, Not Speed, Builds Coherence
Speed alone may produce output, but motion aligned with structure produces coherence. Organisations obsessed with acceleration often bypass enablement systems and create internal turbulence. Features launch without reuse paths. Knowledge circulates without structure. Interfaces remain brittle.
Motion, on the other hand, demands rhythm, feedback, and energy transfer. The Flywheel functions as a converter of directional effort. It absorbs pressure from the surface, filters value, and stabilises the system without halting its evolution.
Coherence emerges not when everyone accelerates together, but when signal travels deliberately through the architecture, earned by design, not forced by deadline.
"Speed fragments. Motion connects."
TQS provides the measurement language for that connection.
Friction and Flow – Concrete Signals
Organisations adopting the Flywheel model can detect whether value is flowing or stalling by examining tangible signals.
Examples of Friction (Low TQS):
- A promising PoC remains isolated within the originating team for over six weeks
- Conversion Rate: 0.5
- Adoption Rate: 0.0
- Interface Maturity Score: 2
- Time to Standardisation: 45 days
- TQS = (0.5 × 0.0 × 2) ÷ 45 = 0
- Flywheel teams receive incomplete or ambiguous signals, requiring frequent clarifications
- Conversion Rate: 0.3
- Adoption Rate: 0.2
- Interface Maturity Score: 1.5
- Time to Standardisation: 35 days
- TQS = (0.3 × 0.2 × 1.5) ÷ 35 ≈ 0.0026
- Reusable components launch with insufficient documentation or without versioning support
- Conversion Rate: 0.7
- Adoption Rate: 0.1
- Interface Maturity Score: 1
- Time to Standardisation: 28 days
- TQS = (0.7 × 0.1 × 1) ÷ 28 ≈ 0.0025
- New platform features are integrated inconsistently across teams, creating duplication and rework
- Conversion Rate: 0.6
- Adoption Rate: 0.3
- Interface Maturity Score: 2.5
- Time to Standardisation: 50 days
- TQS = (0.6 × 0.3 × 2.5) ÷ 50 = 0.009
Examples of Fluid Motion (High TQS):
- A validated experiment becomes a shared SDK module within two sprints
- Conversion Rate: 0.9
- Adoption Rate: 0.8
- Interface Maturity Score: 4.5
- Time to Standardisation: 10 days
- TQS = (0.9 × 0.8 × 4.5) ÷ 10 = 0.324
- Documentation, observability, and onboarding support are bundled before release
- Conversion Rate: 0.95
- Adoption Rate: 0.75
- Interface Maturity Score: 5
- Time to Standardisation: 7 days
- TQS = (0.95 × 0.75 × 5) ÷ 7 ≈ 0.509
- A capability is adopted in at least two distinct product domains without rework
- Conversion Rate: 0.85
- Adoption Rate: 0.9
- Interface Maturity Score: 4.5
- Time to Standardisation: 12 days
- TQS = (0.85 × 0.9 × 4.5) ÷ 12 ≈ 0.286
- Teams request new features through structured intake and receive composable solutions
- Conversion Rate: 0.8
- Adoption Rate: 0.85
- Interface Maturity Score: 5
- Time to Standardisation: 9 days
- TQS = (0.8 × 0.85 × 5) ÷ 9 ≈ 0.378
TQS helps organisations move beyond anecdotes. It makes friction visible, and progress trackable.
Conclusion:
Adopting a fluid organisation requires more than ceremonies and roles. It requires feedback-informed motion. TQS offers a way to see whether your system not only moves fast, but matures what should persist.
Let coherence, not chaos, be the outcome of speed.
Reference: The original working draft and iterative notes for this article are maintained publicly in this Github repository. Contributions and discussion are welcome.


Member discussion