Measuring Turbulence in the Fluid Organisation with Org Re

Introduction
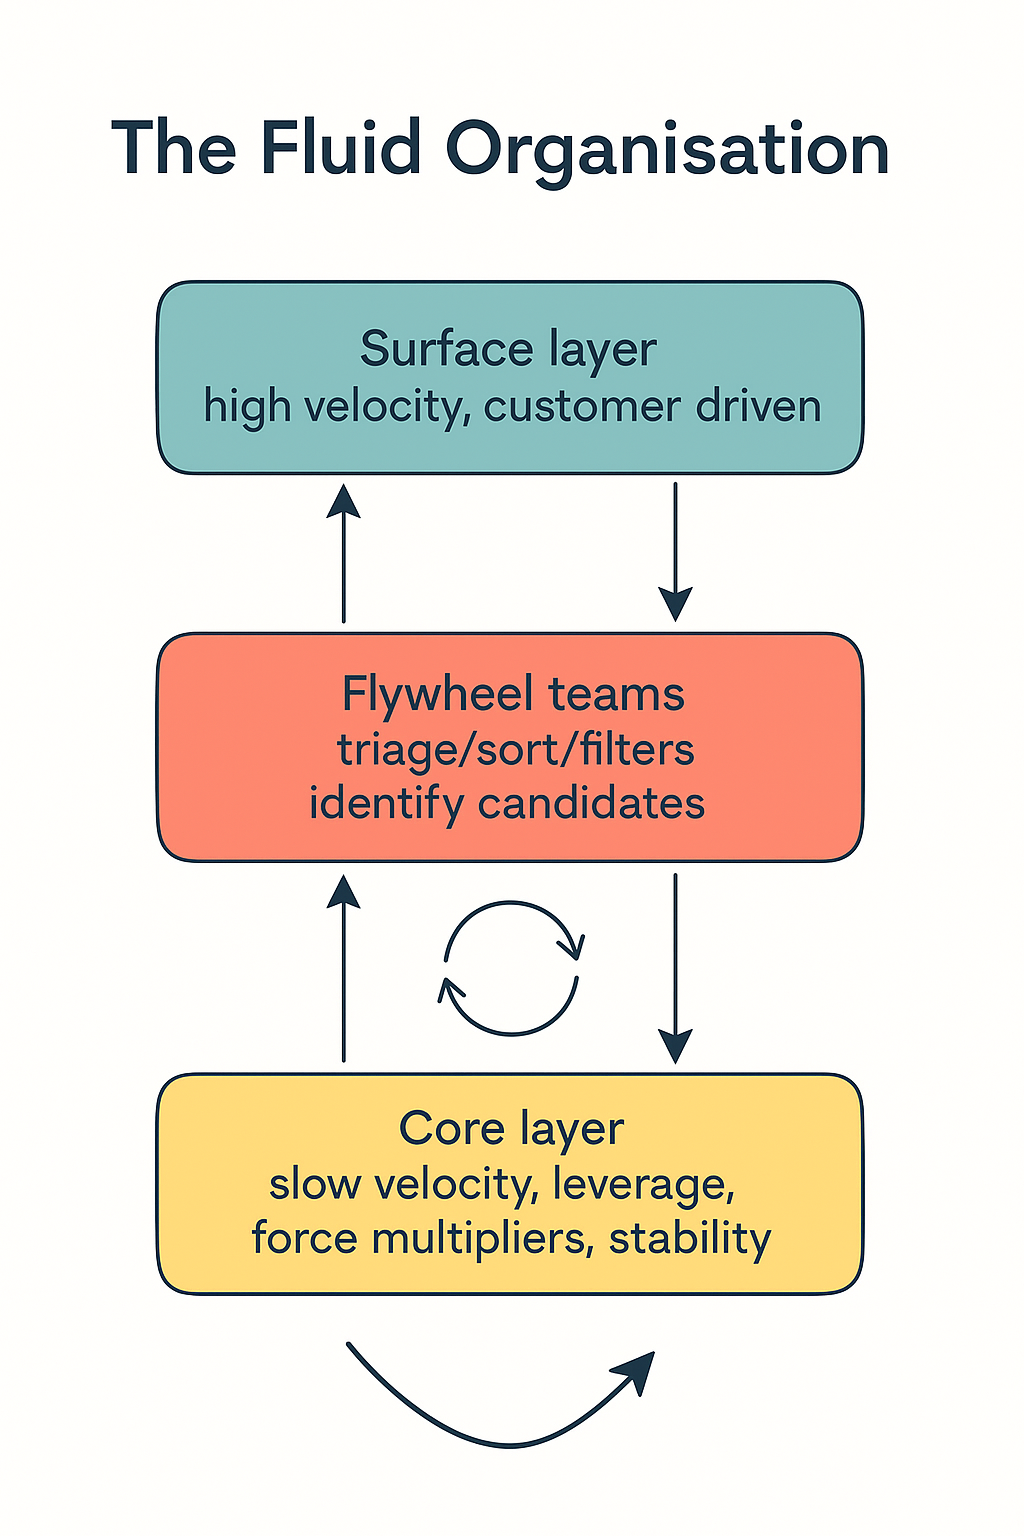
The Fluid Organisation is a structural response to fragmentation caused by teams operating at different velocities and levels of maturity. It is composed of three delivery strata:
- Surface: Rapid product delivery teams
- Flywheel: An adaptive interface layer that metabolises signal into reusable capability
- Core: Stable infrastructure and shared platforms
To diagnose and guide such a system, the model introduces three core metrics:
- Org Re (Organisational Reynolds Number): Measures turbulence in delivery
- TQS (Transduction Quality Score): Captures the fidelity of reuse
- Entropic Pressure: Reveals structural strain under change
Most organisations measure what is easy : velocity, throughput, completion rate. But these metrics often lag the real problems: entropy, fragmentation, delivery breakdown.
Enter Org Re : the Organisational Reynolds Number.
Inspired by fluid dynamics, Org Re measures the turbulence of work. It tells us not how fast we are moving, but how chaotic that motion is.
This article unpacks the concept of Org Re, how it works inside the Fluid Organisation, and why it matters as a diagnostic tool for engineering, platform, and product teams alike.
Org Re vs Reynolds Number – A Structural Analogy
In physics, the Reynolds number is defined as:
Re = (inertial force) ÷ (viscous force) = (ρ × v × L) ÷ μ
Where:
- ρ = fluid density
- v = flow velocity
- L = characteristic length (e.g. pipe diameter)
- μ = dynamic viscosity
In the Fluid Organisation, we adapt this to:
Org Re = (Delivery Velocity × Change Intensity) ÷ Structural Maturity
Mapping the Analogy:
- Delivery Velocity mirrors v: how fast things move
- Change Intensity plays the role of ρ × L: the scale and density of what is changing
- Structural Maturity substitutes μ: resistance, clarity, absorption capacity
Just as turbulence emerges when inertial forces overcome resistance in physical systems, organisational chaos emerges when change outpaces structure.
The Org Re Formula (Conceptual)
Org Re ≈ (Delivery Velocity × Change Intensity) ÷ Structural Maturity
- Delivery Velocity: how frequently units of change are shipped (e.g. deploys per week per team)
- Change Intensity: how novel or divergent the changes are. Novelty can include the introduction of completely new flows, technologies, or integrations. While novelty is often scored qualitatively (e.g. using a 1–5 scale by teams), it can be partially grounded in real data such as unique file paths, service call graphs, or component churn rates. A calibration phase may be required to align scoring across teams, similar to story point estimation in agile contexts.
- Structural Maturity: how well interfaces, contracts, or organisational structures support reuse and absorption (e.g. clear ownership, fallbacks, discoverability, integration ease). Like change intensity, maturity may be scored using a 1–5 rubric aligned across teams. Some signals can also be derived from observable data, such as onboarding success rates, incident frequency, or adoption latency.
A Historical Aside
The Reynolds number was originally formalised by Osborne Reynolds in the 1880s to understand when fluid flow became chaotic. Its principles were later applied, believe it or not, to designing better fountain pens and ink delivery systems. The same physical intuition applies here: when motion outruns structure, turbulence takes over.
Why Org Re Matters
Traditional metrics like cycle time or lead time show symptoms. Org Re shows the system pressure.
- High Org Re precedes burnout: teams are moving fast but with constant rework
- High Org Re weakens reuse: logic gets copied, not standardised
- High Org Re misguides governance: platform teams react instead of metabolise
Org Re helps leaders ask: Are we scaling coherence or just motion?
Org Re in the Fluid Organisation
The Fluid Org introduces Flywheel patterns precisely to absorb high Org Re:
- Signal Clinics triage novel inputs
- Flow Cells stabilise high-entropy zones
- Shadow Integrators reduce interface collisions
Org Re becomes not just a signal, but a trigger for structural design.
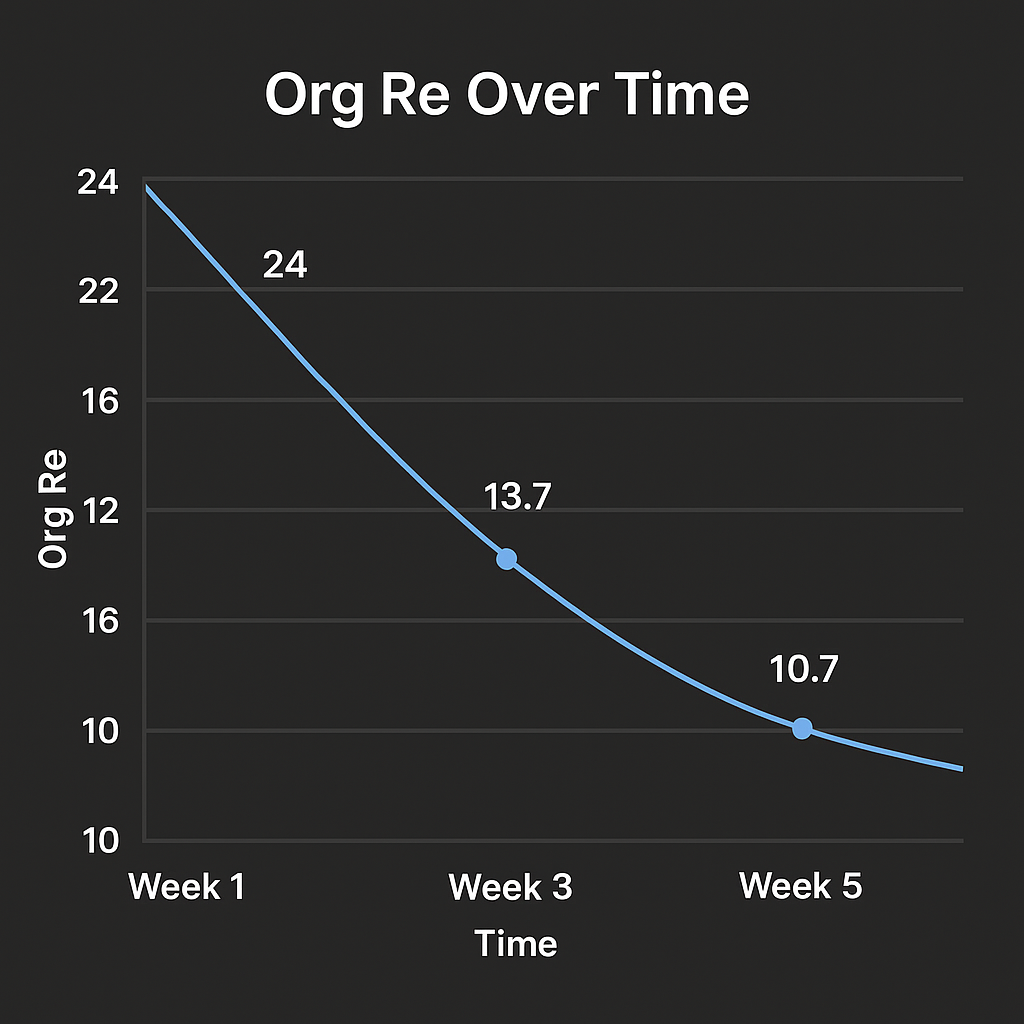
Numerical Scenario (Sprint-Based)
Week 1:
- 4 teams
- 3 deploys per week per team = 12 deploys
- High novelty (score 4)
- Low maturity interfaces (score 2)
- → Org Re ≈ (12 × 4) ÷ 2 = 24
- (high)
Week 3:
- 4 teams
- 3 deploys per week per team = 12 deploys
- Novelty remains high (score 4)
- Clinics and triage improve maturity (score 3.5)
- → Org Re ≈ (12 × 4) ÷ 3.5 = 13.7 (improving) → Org Re ≈ 48 ÷ 3.5 ≈ 13.7
- (improving)
Week 5:
- 4 teams
- 3 deploys per week per team = 12 deploys
- Novelty begins to decline slightly as new interfaces stabilise (score 3.5)
- Interface maturity reaches high stability (score 4.5)
- → Org Re ≈ (12 × 3.5) ÷ 4.5 ≈ 9.3 (healthy) → Org Re ≈ 48 ÷ 4.5 ≈ 10.7
- (healthy)
Org Re Spectrum Guide
| Org Re Level | Description |
|---|---|
| < 10 | Low-friction, aligned flow |
| 10–20 | Caution zone – potential rework and drift |
| > 20 | High strain – unstable and unsustainable |
Reading Org Re in Practice
- Rising Org Re = unmanaged demand, brittle interfaces
- Falling Org Re = friction resolved, structure absorbing velocity
- Oscillating Org Re = local wins without systemic feedback
Track it over sprints. Plot it alongside Entropic Pressure and TQS.
Conclusion
Org Re gives modern teams something rare: a way to see turbulence before it becomes collapse. In a Fluid Organisation, it helps convert speed into insight.
Because the goal is not more velocity, it is coherent motion.
Org Re is not another dashboard number. It is a mirror to how your system absorbs change.
Marc Daniel Ortega


Member discussion