Measuring Motion: A Metric Framework for the Fluid Org Model

Introduction: From Speed to Structure
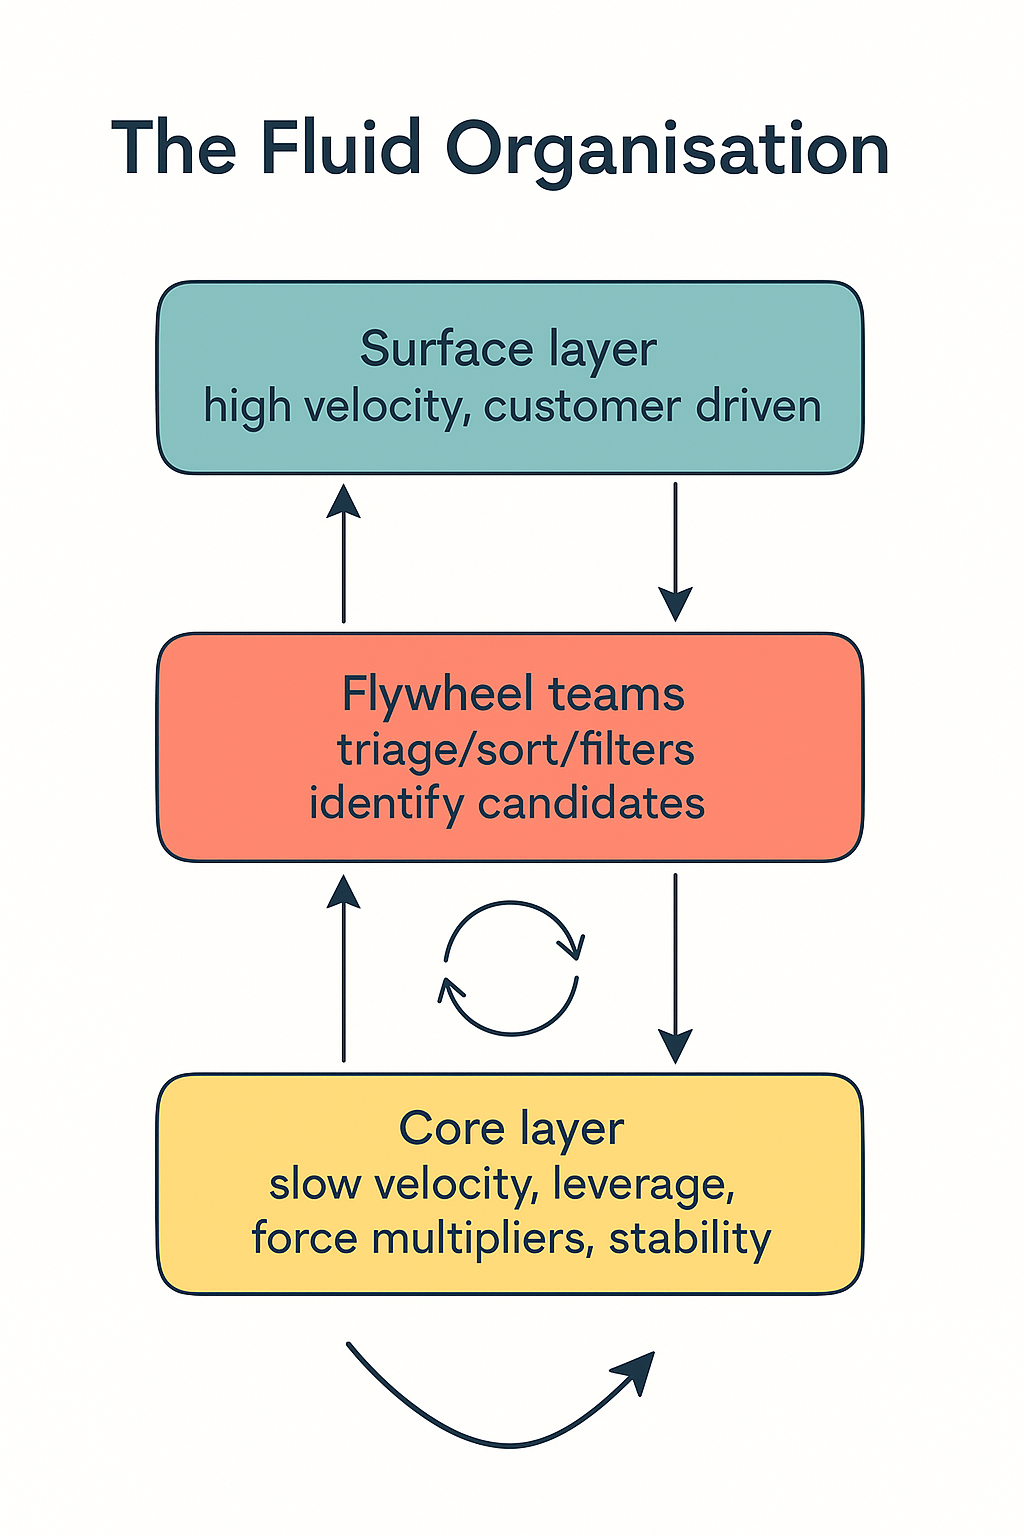
The Fluid Organisation proposes a model where teams operate at different velocities across three primary layers:
- Surface: Fast-moving, exploratory product teams
- Flywheel: An adaptive interface layer that triages, absorbs, and standardises
- Core: Stable, foundational capabilities and infrastructure
Rather than enforce uniform velocity, the model enables coherence through layered motion. But motion without measurement invites drift. To understand, debug, and evolve a Fluid Organisation, we must be able to observe its health. That requires metrics.
Why These Metrics Matter
Each of the three metrics in the Fluid Organisation model represents a unique dimension of organisational motion:
- Org Re captures structural tension
- TQS reflects transformation quality
- Entropic Pressure tracks coherence under stress
All three rely on a shared foundational input: Interface Maturity.
Interface Maturity is a composite score (typically 1–5) that represents how well interfaces are structured, documented, versioned, and governed. It is the common denominator in each formula:
- When maturity is low, velocity and change create chaos
- When maturity rises, the same delivery produces less strain
Because it is qualitative, Interface Maturity must be calibrated, like sprint effort estimation. Without a shared frame of reference, it risks becoming noise in your metrics.
With this foundation in mind, we now explore each metric in turn.
1. Org Re (Organisational Reynolds Number)
We present both the practical formula for measurement and the conceptual lens that inspired it.
Primary Formula (real-world):
Org Re = (Delivery Velocity × Team Count) ÷ Interface Maturity
- Delivery Velocity: Number of deploys or features shipped in a given time frame
- Team Count: Total teams contributing to delivery within the measured scope
- Interface Maturity: Composite 1–5 score of stability, documentation, discoverability, and versioning across interfaces used
This metric helps identify when the rate of delivery is dangerously outpacing the maturity of shared interfaces.
Conceptual Lens (for theory alignment):
Org Re is adapted from the Reynolds Number in fluid dynamics, which models the ratio between inertial forces and viscous damping. High Org Re implies chaotic motion (organisational turbulence), while lower values suggest smoother, stable flow.
We use the real-world formula in operational contexts, and the conceptual framing to explain systemic risk.
2. TQS (Transduction Quality Score)
We introduce two versions of the TQS formula: one practical and one conceptual. While the conceptual version explains the underlying intuition, the real-world formula is more actionable.
Primary Formula (real-world):
TQS = (Conversion Rate × Adoption Rate × Interface Maturity Score) ÷ Time to Standardisation
- Conversion Rate: Percentage of signals that are absorbed and converted into Flywheel output (e.g. templates, services)
- Adoption Rate: Percentage of surface teams using the Flywheel output within a defined period
- Interface Maturity Score: A 1–5 score reflecting clarity, discoverability, and stability of the Flywheel output
- Time to Standardisation: Number of weeks it takes for the Flywheel output to be absorbed into platform defaults or paved paths
This formula is best used in retrospective or operational reviews to score how well Flywheel efforts translate input into lasting capability.
Conceptual Lens (for theory alignment):
TQS = (Signal Clarity × Output Reuse Quality) ÷ Transduction Noise
This reflects the ideal signal fidelity and transformation performance, aligning the score with systems thinking terminology.
We focus operationally on the first formula, while keeping the second in mind as a conceptual frame.
3. Entropic Pressure
As with the other metrics, we provide both an applied formulation and a conceptual interpretation.
Primary Formula (real-world):
Entropic Pressure = (Interface Change Rate × Delivery Velocity) ÷ Interface Maturity
- Interface Change Rate: Number of boundary changes (e.g. schema shifts, endpoint updates) over a fixed interval
- Delivery Velocity: Number of deploys or outputs shipped in the same interval
- Interface Maturity: 1–5 score representing interface stability, versioning, clarity, and adoption tooling
This formula captures when a system is under more change stress than it can structure or absorb.
Conceptual Lens (for theory alignment):
In thermodynamic systems, pressure arises when particles move with energy within a confined space. Similarly, in organisations, Entropic Pressure increases when change and delivery accelerate without stabilising structures. The Flywheel’s role is to act as a buffer and transducer, allowing pressure to be metabolised without rupture.
We apply the operational formula in scorecards, retrospectives, and Flywheel feedback loops, while the conceptual frame supports systemic analysis.
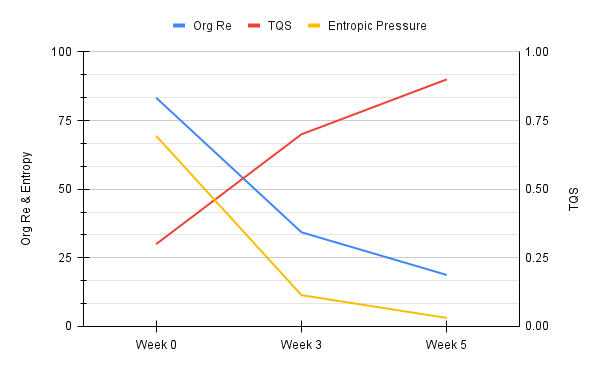
Numerical Example: Feature Convergence
This example assumes a standard two-week sprint cadence. Deploys are used as a practical measure of delivery velocity across teams within each sprint interval. Interface Maturity is scored collaboratively by team leads to ensure calibration.
A product team introduces a user preferences microservice. It is built rapidly in response to market feedback. The implementation is local, undocumented, and tightly scoped to one team's feature flag system. Within two weeks, five other teams build similar variants for slightly different use cases, unaware of each other's efforts.
Flywheel is not initially engaged. Teams duplicate logic, adapt fields inconsistently, and create configuration drift across the environment.
Week 0:
Sprint 1 begins with a single team implementing a user preferences microservice. The implementation is tightly scoped, undocumented, and tailored to their internal tooling. Within two weeks, five other teams independently build their own versions, each addressing slightly different use cases but without coordination. The result is five divergent variants, no documentation, no ownership, and growing inconsistency.
- Deploys = 25
- Teams = 6
- Interface Maturity = 1.8
- Org Re = (25 × 6) ÷ 1.8 = 83.3
- TQS = 0.3 (low: multiple forks, poor documentation)
- Entropic Pressure = (5 × 25) ÷ 1.8 = 69.4
Flywheel Response: Co-designs a reusable version with two teams
Week 3:
By the end of sprint 2, the Flywheel team has intervened. They engage with two of the six teams to identify overlap and stabilise a common implementation pattern. A draft reusable version is co-designed. Basic documentation is created, describing key fields and configuration. A shared repository is established, and early ownership is assigned. Versioning and naming standards begin to take shape, setting the stage for broader adoption.
- Deploys = 20
- Teams = 6
- Interface Maturity = 3.5
- Org Re = (20 × 6) ÷ 3.5 = 34.3
- TQS = 0.7 (moderate: template released)
- Entropic Pressure = (2 × 20) ÷ 3.5 = 11.4
Week 5:
By the end of sprint 3, the reusable microservice has been adopted by four teams. Continuous feedback helps refine edge cases and configuration options. Full documentation is completed, covering usage guides, fallback behaviours, and integration instructions. The component is now versioned and owned, and the platform team embeds it into the paved path catalogue. The interface is considered mature, discoverable, and supported.
- Deploys = 15
- Teams = 6
- Interface Maturity = 4.8
- TQS = 0.9
- Org Re = (15 × 6) ÷ 4.8 = 18.75
- Entropic Pressure = (1 × 15) ÷ 4.8 = 3.1
This reflects convergence. ΔEntropy declines. TQS rises. Reuse stabilises.
How to Calibrate Thresholds
Understanding when a metric signals risk is not always about absolute numbers. It is about patterns, change, and context. We recommend teams treat thresholds as emergent heuristics, not fixed limits.
1. Start from real examples Review past incidents or system pain points. What Org Re or Entropic Pressure values were present? Did a TQS dip precede fragmentation? Use history to infer early warning levels.
2. Use maturity bands as anchors Map Interface Maturity to reasonable operational ceilings:
- Level 2 maturity should not exceed Org Re of 40
- TQS below 0.5 often signals adoption friction
- Entropic Pressure above 30 in low-maturity systems is unsustainable
3. Track deltas, not just values Rapid increases in Org Re or Entropic Pressure matter even if they remain below risk thresholds. Change rate is often more important than raw level.
4. Cluster your data Over time, plot metrics and outcomes to identify inflection points. Common clustering will reveal high-risk bands.
These thresholds are not imposed. They are discovered. Teams should revisit them regularly, just like velocity calibration.
Looking Ahead
These three metrics provide a coherent, minimal framework. They are sufficient to detect, interpret, and guide systemic change. However, additional signals may be needed for nuance:
- Alignment Drift: Gap between product intent and architectural result
- Feedback Latency: Time from issue to triage
- Reuse Drag: Cost of consuming golden paths
These can be introduced later as derived metrics. For now, Org Re, TQS, and Entropic Pressure give leaders a powerful, foundational lens to steer systems that flow.


Member discussion